All gains from the last 3 years have been erased. Actually the first time they reached this price was in januari 2021.
Does it matter? It’s a noob question here, as I’m not sure to understand what you want to say and if that matter the first time it was at a certain price. I would have thought the last time was what mattered.
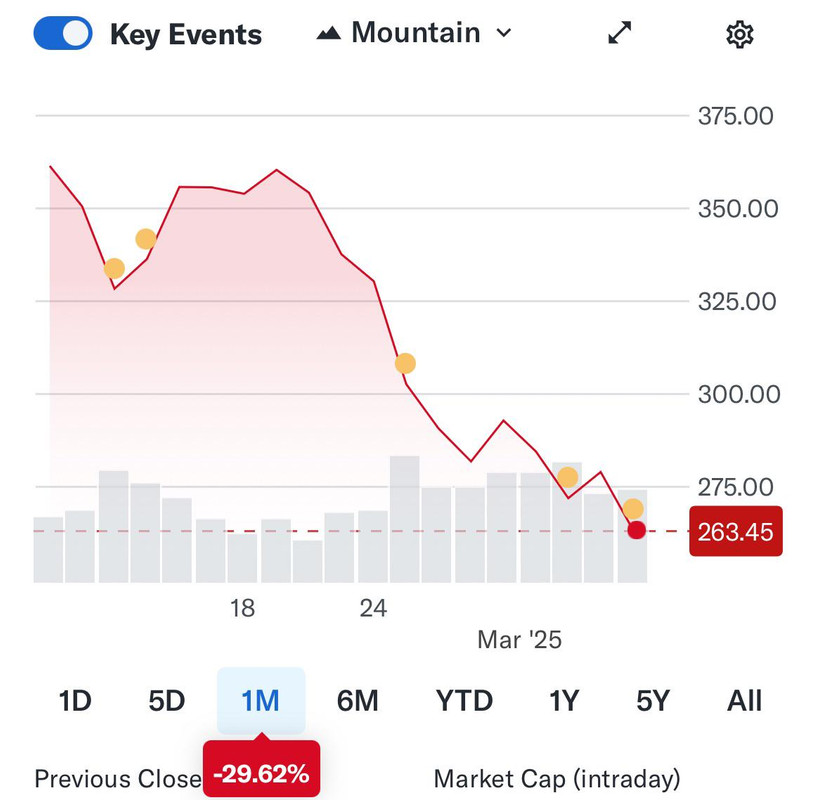
I just checked the graph (i don’t much stock, so I need to check data ;) and to me it looks like Tesla is down to its Oct/November 24 (not 2021) price which is already an impressive drop (and it looks it will keep going down today too). But it also has been at that level more than a few time since 2021. And reached much lower in early 2023, somewhere in the 100-120, and at 175 in May 2024
What’s interesting looking at the graph is to see how often those lows are followed by a bounce… I would be curious to see how much more it will go down (and for how long) before it bounces again… If I had a Cristal ball I would be rich, I suppose :p


All gains from the last 3 years have been erased. Actually the first time they reached this price was in januari 2021.
Does it matter? It’s a noob question here, as I’m not sure to understand what you want to say and if that matter the first time it was at a certain price. I would have thought the last time was what mattered.
I just checked the graph (i don’t much stock, so I need to check data ;) and to me it looks like Tesla is down to its Oct/November 24 (not 2021) price which is already an impressive drop (and it looks it will keep going down today too). But it also has been at that level more than a few time since 2021. And reached much lower in early 2023, somewhere in the 100-120, and at 175 in May 2024
What’s interesting looking at the graph is to see how often those lows are followed by a bounce… I would be curious to see how much more it will go down (and for how long) before it bounces again… If I had a Cristal ball I would be rich, I suppose :p