- cross-posted to:
- technews@radiation.party
- cross-posted to:
- technews@radiation.party
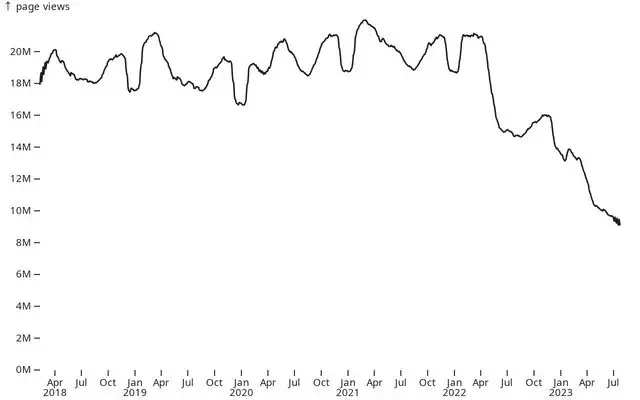
Over the past one and a half years, Stack Overflow has lost around 50% of its traffic. This decline is similarly reflected in site usage, with approximately a 50% decrease in the number of questions and answers, as well as the number of votes these posts receive.
The charts below show the usage represented by a moving average of 49 days.
What happened?


You’ve assumed that I want to explain the root cause of the initial decline. This is not the case. Historically, SO has seen several periods of decline. What I’m actually addressing is the question of why the decline has not stopped, because the sustained nature of this decline is what makes it unusual. If you look at the various charts, you can see a brief rally which gets cut off in late Winter 2022 – this lines up rather nicely with the timing of ChatGPT’s release, I feel.
Let’s ignore that. Tell me more about your Google angle: what’s the basis of your hypothesis?
I’m not who you were speaking to, but back when I used to read it occasionally, the stack overflow blog repeatedly mentioned that the vast majority of its traffic comes from Google. If the vast majority of your traffic comes from Google and then your traffic quantity changes dramatically, it’s reasonable to look to the source of your traffic.
Thank you for doing my work for me. It’s just Occam’s razor.