- cross-posted to:
- technews@radiation.party
- cross-posted to:
- technews@radiation.party
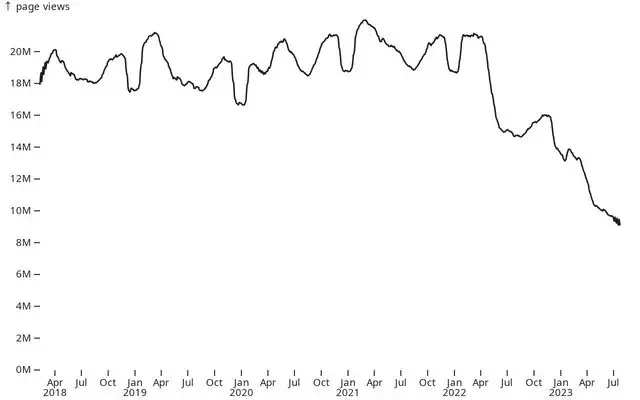
Over the past one and a half years, Stack Overflow has lost around 50% of its traffic. This decline is similarly reflected in site usage, with approximately a 50% decrease in the number of questions and answers, as well as the number of votes these posts receive.
The charts below show the usage represented by a moving average of 49 days.
What happened?


Can you give more context on the second one? Everyone can edit posts and it shows both the original poster as well as the most recent editor on the post. (I’m not defending SE. I dislike them too.)